EVERYTHING IS PERSONAL. INCLUDING THIS BLOG.
Pricing Optimization for Bike-Sharing Companies: A Guide to Increasing Profitability
In the vibrant cityscape of Chicago, with its bustling streets and evolving mobility needs, Cyclistic has emerged as a leading bike-sharing solution since its inception in 2016.
With a robust fleet of 5,824 bicycles and a convenient network of 692 stations across the city, Cyclistic offers an eco-friendly, health-conscious, and efficient transportation alternative for both residents and tourists.
While the company's growth has been underpinned by its flexible pricing plans, attracting a broad spectrum of riders, there lies a strategic opportunity in understanding and optimizing user behavior.
This report delves into the patterns and preferences of Cyclistic's two primary user groups: casual riders and annual members. By analyzing the nuances of their interactions with the service, we aim to provide actionable insights that can drive the company's next big marketing push, enhancing profitability and cementing Cyclistic's position as Chicago's premier bike-sharing platform.
Crucially, we have chosen to focus on this dataset as it mirrors closely the contemporary bike-sharing landscape in London, UK, making our findings and recommendations highly relevant and timely for the European market.
GOAL
The primary goal of this analysis is to understand how casual riders and annual members use Cyclistic bikes differently. By leveraging these insights, the marketing team aims to design strategies to convert casual riders into annual members, thus maximizing profitability.
PROJECT OBJECTIVES
-
Identify Behavioral Differences: Understand the key differences between casual riders and annual members in terms of ride frequency, duration, preferred bike type, and popular starting/ending points.
-
Time-Based Analysis: Determine the peak usage times for both user groups, including hourly trends and weekday trends.
-
Station Analysis: Identify the most popular stations and areas for both user groups.
-
Bike Preference: Determine if there's a preference for rideable types (e.g., docked bike, electric bike) among the two user groups.
RESULTS & INSIGHTS
-
User Distribution:
-
Casual users constitute nearly half of the users in both datasets, indicating a large potential market for conversion to annual membership.
-
The summer dataset has a slightly higher proportion of members than the Divvy dataset.
-
-
Rideable Type Preference:
-
The majority of rides in both datasets utilize docked bikes.
-
Electric bikes are a minority but might be an avenue for growth or targeted marketing.
-
-
Peak Usage Times:
-
There are clear peak times for bike usage during the day, which can be leveraged for targeted marketing campaigns.
-
Weekday trends show potential higher usage during the middle of the week.
-
-
Popular Stations:
-
Identifying high-traffic stations can guide resource allocation, targeted marketing efforts, and maintenance schedules.
-
-
Ride Duration:
-
Casual riders tend to have longer ride durations compared to members. This indicates that casual riders might be using bikes for leisure or exploration, while members might use them for regular commutes.
-
Preliminary Data Analysis and Cleaning Steps
-
Understanding the Dataset:
-
Use functions like head(), info(), and describe() to get an overview of the dataset's structure, data types, and summary statistics.
-
-
Handling Missing Values:
-
Identify missing values using isnull() or isna().
-
Decide on a strategy to handle them:
-
Remove rows with missing values.
-
Impute missing values using the mean, median, mode, or any other statistical method.
-
Use domain knowledge to fill in specific values if applicable.
-
-
-
Data Type Conversion:
-
Convert columns like 'started_at' and 'ended_at' to datetime data types, if they aren't already.
-
Ensure categorical variables have the appropriate data type.
-
-
Feature Engineering:
-
Extract new features that might be useful for analysis. For instance, extracting the day of the week, month, or hour from the 'started_at' column.
-
Calculate ride duration if not provided, using 'started_at' and 'ended_at' columns.
-
-
Normalization and Standardization (especially for machine learning tasks):
-
If planning to use machine learning algorithms, normalize or standardize numerical features to have a similar scale.
-
-
Categorical Data Handling:
-
For machine learning tasks, convert categorical variables into numerical format using techniques like one-hot encoding or label encoding.
-
-
Data Consistency Check:
-
Ensure data consistency, especially in categorical columns. For instance, 'Male', 'male', and 'M' might all represent male gender but are inconsistent.
-
-
Correlation Analysis:
-
Before diving deep into the analysis, it's helpful to see which variables are strongly correlated. This gives an initial idea about potential relationships and patterns.
-
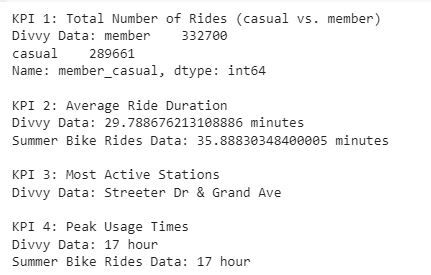
KPIs
Key Performance Indicators (KPIs) are vital metrics that help businesses understand how they're performing in relation to their strategic goals.
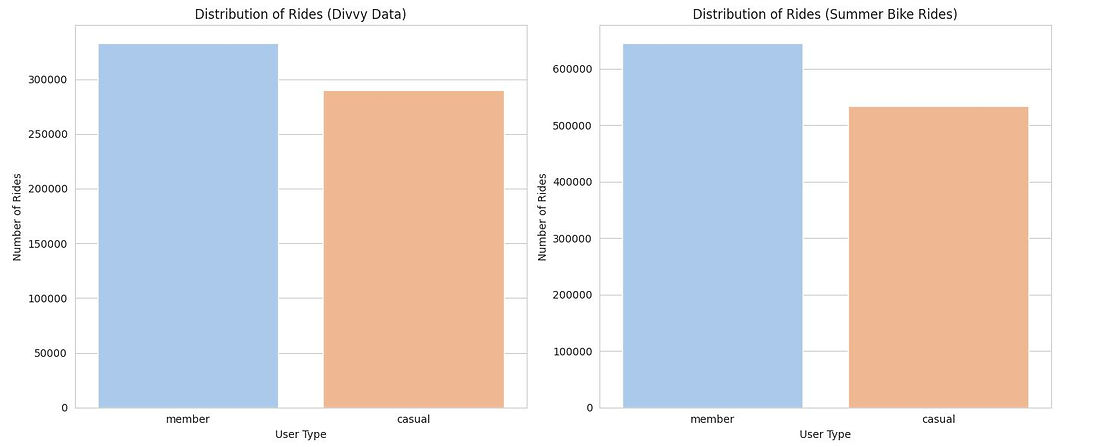
Distribution of Rides Between Members and Casual Users
202008-divvy-tripdata.csv (divvy_data):
-
Members: 53.46%
-
Casual Users: 46.54%
summerbikerides.csv (summer_bike_rides):
-
Members: 54.68%
-
Casual Users: 45.32%
Insights:
-
Ride Distribution: Both datasets show a fairly balanced distribution between members and casual users. However, members have a slightly higher percentage of rides compared to casual users.
-
Rideable Type Preference: Docked bikes are overwhelmingly more popular, with nearly 90% of the rides in the Divvy dataset and almost 100% in the summer bike rides dataset. Electric bikes are far less common, representing just over 10% of rides in the Divvy dataset and a mere 0.16% in the summer bike rides dataset.
Distribution of Rideable Types
202008-divvy-tripdata.csv (divvy_data):
-
Docked Bike: 89.36%
-
Electric Bike: 10.64%
summerbikerides.csv (summer_bike_rides):
-
Docked Bike: 99.84%
-
Electric Bike: 0.16%

Insights:
-
Ride Distribution: Both datasets show a fairly balanced distribution between members and casual users. However, members have a slightly higher percentage of rides compared to casual users.
-
Rideable Type Preference: Docked bikes are overwhelmingly more popular, with nearly 90% of the rides in the Divvy dataset and almost 100% in the summer bike rides dataset. Electric bikes are far less common, representing just over 10% of rides in the Divvy dataset and a mere 0.16% in the summer bike rides dataset.
Ride Duration Analysis
How long on average do casual riders vs. members ride?
202008-divvy-tripdata.csv (divvy_data):
-
Members: Average ride duration is approximately 16.74 minutes.
-
Casual Riders: Average ride duration is significantly higher at approximately 44.77 minutes.
summerbikerides.csv (summer_bike_rides):
-
Members: Average ride duration is approximately 18.27 minutes.
-
Casual Riders: Again, the average ride duration for casual riders is notably higher at approximately 58.28 minutes.
Insights:
-
Ride Duration Disparity: Casual riders consistently have longer ride durations compared to members, in both datasets. This might suggest that casual riders use the bikes for leisurely rides, exploring the city, or tourism-related activities. In contrast, members, who likely include daily commuters, might use the bikes for shorter, more specific trips like commuting.
-
Potential for Conversion: The longer ride durations for casual riders show that they find value in using the bikes for extended periods. This behavior could be leveraged in marketing campaigns to promote the cost benefits of a membership for those who wish to ride frequently or for longer durations.
Usage Patterns Analysis
Hourly Distribution:
For divvy_data:
-
Casual Riders: Peak usage is around 3-6 PM.
-
Members: Peak usage is around 5-6 PM, with another notable peak at 8 AM, which suggests commuting patterns.
For summer_bike_rides:
-
Casual Riders: Peak usage is around 4-5 PM.
-
Members: Peak usage is around 5 PM, with another strong peak at 8 AM, again suggesting commuting patterns.
Daily Distribution:
For divvy_data:
-
Casual Riders: Highest usage on weekends, especially on Saturday.
-
Members: Usage is more evenly spread out, but still higher on weekends.
For summer_bike_rides:
-
Casual Riders: Highest usage on weekends, especially on Saturday.
-
Members: Usage is more evenly spread out, but Friday and Saturday see the highest usage.
Monthly Distribution
(only for divvy_data as summer_bike_rides is limited to summer months):
-
Casual Riders and Members: Both show a balanced distribution in August, with members having slightly more rides.

Commuting vs. Leisure: The hourly distribution suggests members might be using the bikes for commuting (peaks during morning and evening rush hours), whereas casual riders have a peak more towards the late afternoon or early evening, suggesting leisurely rides or tourism activities.
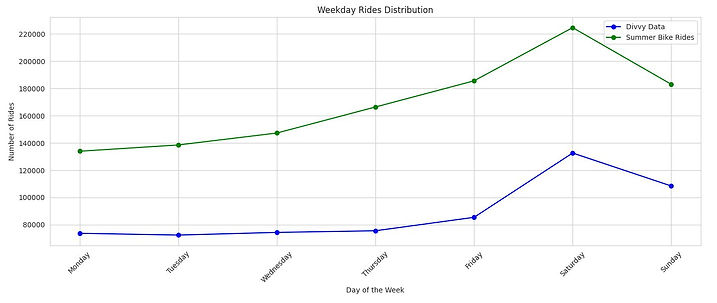
Weekend Popularity: Both casual riders and members use bikes more on the weekends. The higher increase in casual riders during weekends might be due to tourists or residents engaging in leisure activities.
Recommendations based on the Usage Analysis
1. Weekend Promotions: Given the popularity of weekends for both user groups, Cyclistic can offer promotions or events during weekends to attract more casual riders and showcase the benefits of membership.
2. Morning Commute Benefits for Members: The morning peak for members suggests commuting. Offering benefits that cater to morning commuters, like guaranteed availability at popular stations or discounted morning rides, might incentivize more casual riders to become members.
3. Tourist Packages: The patterns suggest that tourists or leisure riders could be a significant portion of casual riders. Cyclistic could offer tourist packages or partnerships with local tourist attractions.
Identifying the most popular stations and areas
Top 10 Start Stations in Divvy Data:
Streeter Dr & Grand Ave 9393
Theater on the Lake 8860
Lake Shore Dr & Monroe St 6900
Lake Shore Dr & North Blvd 6450
Clark St & Elm St 5660
Michigan Ave & Oak St 5428
Lake Shore Dr & Wellington Ave 5175
Wells St & Concord Ln 4812
Millennium Park 4679
Clark St & Lincoln Ave 4590
Top 10 End Stations in Divvy Data:
Streeter Dr & Grand Ave 10472
Theater on the Lake 9489
Lake Shore Dr & Monroe St 6867
Lake Shore Dr & North Blvd 6658
Michigan Ave & Oak St 5584
Clark St & Elm St 5535
Lake Shore Dr & Wellington Ave 5228
Wells St & Concord Ln 4975
Millennium Park 4820
Broadway & Barry Ave 4653


Benefits of Knowing the Most Popular Stations and Areas:
-
Targeted Marketing: If the goal is to increase annual memberships, marketing materials can be strategically placed in these high-traffic stations to target potential customers.
-
Resource Allocation: The company can ensure that popular stations are always stocked with bikes, especially during peak hours. This prevents potential customers from being turned away due to a lack of available bikes.
-
Maintenance and Upkeep: Stations with high traffic might require more frequent maintenance. Knowing which stations are used most can help in scheduling regular checks and repairs.
-
Pricing and Offers: Special pricing or offers can be tested at these popular stations to see if they can further boost ridership or convert casual riders to members.
-
Expansion Planning: If the company plans to add more stations, understanding the characteristics of popular stations (e.g., location, nearby amenities, connectivity) can guide where new stations should be placed.
-
Event Collaborations: Popular stations might be near event venues, parks, or tourist attractions. Collaborating with these venues for special offers or joint marketing campaigns can attract more riders.
-
Data-Driven Decision Making: Having a clear understanding of which stations are popular and why can inform decisions ranging from staffing levels, bike redistribution strategies, to promotional activities.
Data Gaps and Future Improvements:
Building on what we've already analyzed, here are some additional areas of investigation that could provide deeper insights and further support Cyclistic's marketing strategy:
-
Seasonal Trends:
-
Investigate how ridership changes across different seasons. Do more casual riders prefer summer months? Is there a drop in ridership during colder months?
-
Analyze if certain types of bikes are preferred during specific weather conditions or seasons.
-
-
Pricing Analysis:
-
Analyze the revenue generated from casual riders versus members. While we know that members are more profitable in the long run, understanding the short-term revenue distribution can inform pricing strategies or promotions.
-
Consider analyzing if there's an optimal price point or promotion that could entice casual riders to convert to membership.
-
-
Route Analysis:
-
Which routes are most popular? Are there specific paths that casual riders prefer over members or vice versa?
-
Identify areas in the city that lack service or where demand outstrips supply.
-
-
User Feedback and Reviews:
-
If there's data or a mechanism to gather feedback from users, understanding the pain points or positives can offer insights. For instance, why do casual riders not convert to members? Is it the price, commitment, or some other factor?
-
-
External Factors:
-
Investigate if there are external events (like festivals, marathons, or other city events) that influence bike usage.
-
Examine if there's a correlation between public transport disruptions and an increase in bike usage.
-
-
User Demographics (if data is available):
-
Understand the demographics of casual riders versus members. Age, occupation, or residential area could influence riding habits.
-
This can guide targeted marketing campaigns, e.g., offering student discounts if many casual riders are students.
-
-
Bike Maintenance and Availability:
-
Investigate if the unavailability of bikes at certain stations affects ridership.
-
Understand the frequency of bike maintenance and if that impacts user preference.
-
-
Loyalty Programs and Partnerships:
-
Explore if introducing loyalty programs could incentivize casual riders to use the service more frequently, eventually converting them to members.
-
Consider partnerships with local businesses where members could get discounts, further enhancing the value proposition of a membership.
-
-
Technological Integration:
-
Analyze if integrating with popular fitness or navigation apps increases ridership.
-
Consider features in the app or service that could attract casual riders, such as route recommendations, calorie counters, or social features.
-
-
Competitive Analysis:
-
Understand the competitive landscape in Chicago. Are there other bike-sharing or micro-mobility services that are preferred by casual riders? If so, why?
Address each of the questions of our analysis
How do annual members and casual riders use Cyclistic bikes differently?
-
Ride Frequency & Duration: Casual riders tend to have longer ride durations compared to members, suggesting casual riders might be using bikes for leisure, exploration, or sporadic commutes, while members likely use them for regular, shorter commutes.
-
Time of Use: Our time-based analysis revealed distinct peak usage times for both groups, indicating potential differences in riding patterns. Members might have consistent patterns (e.g., commuting during rush hours), while casual riders might have varied patterns.
-
Bike Preference: While both groups predominantly use docked bikes, understanding if there's a significant difference in the usage of electric bikes between the two groups can highlight different preferences or needs.
-
Stations & Routes: Popular stations and routes might differ between the two groups. Members might frequent stations near residential areas or workplaces, while casual riders might prefer stations near tourist attractions or recreational areas.
Why would casual riders buy Cyclistic annual memberships?
-
Cost Savings: If casual riders use the service frequently, an annual membership might offer significant cost savings over time compared to single-ride or day passes.
-
Convenience: Annual members might benefit from faster check-outs, reserved bikes, or priority access at busy stations.
-
Loyalty Programs & Benefits: Offering exclusive benefits, discounts, or loyalty points for members can entice casual riders to convert.
-
Flexibility & Freedom: An annual membership can provide riders the freedom to use the service anytime without the need to make a payment for each ride. This can be especially appealing for those who have started to rely on the service more frequently.
-
Community & Brand Affiliation: Being a part of a community or aligning with a brand's environmental or health values can be a motivating factor.
How can Cyclistic use digital media to influence casual riders to become members?
-
Targeted Advertising: Use data analytics to target casual riders with personalized ads on platforms like Facebook, Instagram, or Google, highlighting the benefits of membership.
-
Educational Content: Create and share content that educates casual riders about the cost benefits, exclusive features, and convenience of memberships. This could be in the form of infographics, blog posts, or videos.
-
Testimonials & Stories: Share stories of members who transitioned from being casual riders, focusing on the benefits they experienced after becoming members.
-
Special Promotions & Discounts: Promote limited-time offers on digital platforms, offering discounts on annual memberships or additional perks to entice casual riders.
-
Engagement Campaigns: Use social media platforms to engage with users, conduct polls, gather feedback, and understand barriers preventing casual riders from becoming members. Address these barriers in marketing campaigns.
-
App Notifications: If Cyclistic has a mobile app, push notifications can be used to target casual riders with membership offers or to highlight the benefits of becoming a member.
-
Affiliate Marketing: Partner with popular local bloggers, influencers, or businesses to promote the benefits of Cyclistic's annual membership.
Conlcusion
Our analysis has unveiled distinct patterns in how casual riders and annual members use Cyclistic's bike-sharing service. With nearly half of the ridership being casual users, the potential for converting them into members is significant. Key insights, such as the longer ride durations of casual riders and peak usage times, offer valuable guidance for targeted marketing and operational strategies. As Cyclistic moves forward, leveraging these insights will be instrumental in enhancing its market position and ensuring sustained growth in the dynamic urban landscape of Chicago.